How App Companies Can Build Trust with Customers
Learn how app companies can build customer trust through better privacy practices, transparent communication, and stronger security to improve retention and...
Updated December 9, 2025

To determine whether your app is successful, track more than the number of downloads from the app store: performance, usage, engagement, and acquisition.
The number of app downloads is a misleading metric: it tracks how many people download your app instead of whether your app meets its objectives Instead, app developers need to be focusing on app metrics that help them improve the performance of their apps.
User acquisition metrics show how users find your app. They highlight the visibility of your app on app stores, the marketing channels that increase traffic, cost to acquire a user and the revenue your app generates.
Looking for a Mobile App Development agency?
Compare our list of top Mobile App Development companies near you
Acquisition metrics include:
Analyze how existing users found your app to target and acquire new users.
Users reach out to your app through organic search, paid campaigns, social media, referrals, and word of mouth.
Pay attention to the number of users who find your app through an organic search in the app store. Data shows that 65% of users download an app after searching in the app store, which means ranking for organic searches is important.
Cost per Install is the money to acquire one paying app user or subscriber.
To measure the cost per user acquisition, divide the total cost spent on marketing by the number of users it generates.
Cost Per User Acquisition = Number of Users / Cost of Marketing
Customer lifetime value (CLV) is the amount of revenue you acquire from a customer before the user abandons your app.
It is important to monitor this metric because it determines how long you need to retain a user to profit from that user.
Customer Lifetime Value = (Average Conversion Value) (Average Number of Conversions) (Average Lifetime of Customer)
Customer lifetime value should always be greater than the cost per user acquisition, or else you won't be able or scale.
Engagement metrics show how users engage with your mobile app.
They include:
Understanding engagement metrics will inform how you engage and raise the interest of potential users, retain them, and convert them into customers.
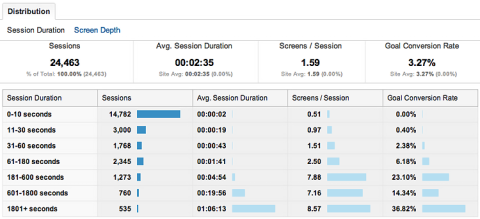
Session length measures the time from when a user first opens your app to when she closes it.
Session length varies for different types of applications. A 90-second session may be ideal for taxi booking app because searching for and ordering a taxi is a quick interaction. However, for a music streaming app, 90-second engagement means the user didn’t make it through one song.
Once you figure out the ideal session length for your application, you can identify where the user feels struck.
Visit frequency measures a number of times your users open your application and begin a session in a specified time interval such as a day or a week.
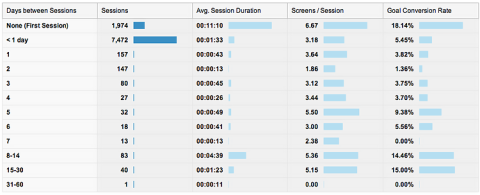
App users with low visit frequency are more likely to abandon your app than users with high visit frequency.
To encourage high visit frequency, make your app part of the user’s routine: contextual notifications, offers, discounts, and updates on new features.
Average page views per session, or the number of app screens a user interacts with during a session, determine the depth of the visit.
The more pages an app user views, the higher the engagement rate.
Ideal page views per session vary. A news application may want to keep their visitors engaged and suggest articles to increase the average views per session. An e-commerce app may want to hook its visitors to a particular product to encourage a quick transaction so average views per session would be lower.
Behavior flow shows the path your user took to navigate through your app. It helps visualize the path users take to move from one screen to another.
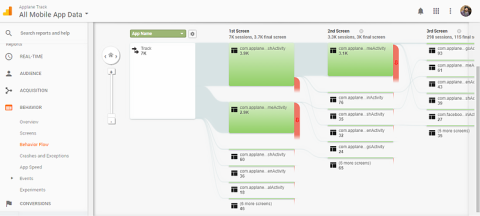
Use behavior flow to determine what content keeps your users engaged, what routes they take to reach your objective, what road bumps they face, and where do they fall off.
Merging behavior flow with average screen-view time can provide you insights like how long a particular task takes and how to reduce the conversion time.
With this data in hand, you can create strategies to re-engage dropped users and implement a clearer funnel.
Active users interact with your app for a specified time.
Active users are most likely to turn into customers because they not only download your app but use it regularly.
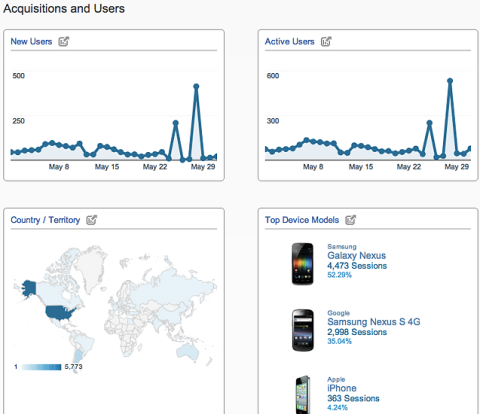
Tracking active users show when new users downloaded and engaged with your app. What caused the increase? Is it replicable to grow your customer base?
Stickiness tells you how often your users return to your app.
A sticky app has a nearly equal amount of daily and monthly active users. For example, let’s say play CandyCrush every day at lunch. The app would have high stickiness because of the daily use.
Stickiness = Daily Active Users/Monthly Active Users
Stickiness varies for different categories of apps: It’s highest for games and lowest for utility apps such as flashlights or calculators.
Stickiness is all about the UI/UX and functionality of the application. You can increase the stickiness by using push notifications encourage app users to visit your app.
Retention metrics measure how well your app keeps users coming back after their first visit, revealing whether people find lasting value in what you’ve built.
Strong retention indicates that your onboarding is effective, your core features are compelling, and users are forming habits around your product. Weak retention, on the other hand, signals friction in the experience, unclear value, or unmet expectations. Overall, retention metrics are a direct indicator of long-term product health and a leading predictor of sustainable growth.
Day 1, Day 7, and Day 30 retention are benchmarks that show how many users return to your app after a certain number of days, and they’re some of the clearest indicators of long-term product health.
Day 1 Retention measures how many users come back the day after they first open your app. It reflects the quality of onboarding and whether users immediately understood the value, while Day 7 highlights early habit formation and whether your core features are engaging enough to pull people back.
However, Day 30 retention metrics are the strongest sign of product-market fit because it shows whether your app has lasting, long-term value.
Each retention metric uses the same formula—just with a different day range:
Retention Rate = (Number of users who return on Day X / Number of users who first used the app on Day 0) × 100
For example:
These metrics help you understand short-term engagement, early value delivery, and long-term stickiness—all essential to diagnosing how healthy your app truly is.
Churn rate measures the percentage of users who stop using your app within a given time period, and it’s one of the most important indicators of product health. While retention shows who stays, churn highlights who leaves, and it may provide insight into why that may be happening.
A high churn rate often signals problems with onboarding, unclear value, poor user experience, performance issues, or unmet expectations, making it essential to diagnose early. Monitoring churn helps teams understand where users drop off in the lifecycle, identify friction points, and prioritize improvements that drive long-term engagement.
It’s typically calculated using a simple formula:
Churn Rate = (Number of users lost during a period / Number of users at the start of that period) × 100.
By tracking churn consistently, you can spot negative trends, validate whether changes improve user loyalty, and ultimately build a more resilient, sticky product.
A cohort retention curve tracks how often groups of users return to your app over time, giving you a clearer and more accurate picture of long-term engagement than single-point retention metrics alone.
Instead of looking at all users as one blended group, cohort curves follow users who started using the app during the same period (such as the same week or month) and show how their retention changes across Day 1, Day 7, Day 30, and beyond.
This makes it easier to spot trends, compare the impact of product updates, and identify exactly when users tend to drop off.
Cohort analysis is especially powerful because it isolates behavioral patterns and reveals which parts of the experience influence retention. The calculation is straightforward:
Cohort Retention = (Number of users in a cohort active on Day X / Total number of users in that cohort on Day 0) × 100.
Tracking these curves over time helps you understand whether your product is improving, stagnating, or losing long-term stickiness—and guides more informed decisions about onboarding, features, and user experience.
App developers need to track monetization product’s business model is truly working and how it’s impacting their business.
Engagement alone doesn’t guarantee a successful app. Rather, developers need to understand how much revenue users generate, which segments are most valuable, and how efficiently the app converts free users into paying customers.
These metrics also reveal whether the app can scale profitably, guide pricing decisions, and help teams optimize features that drive long-term revenue growth.
Lifetime Value measures the total revenue a single user is expected to generate over the entire time they use your app.
LTV is important because it helps you understand how much you can afford to spend on acquiring new users, which user segments are most profitable, and whether your monetization strategy is sustainable. It also ties closely to retention, since long-lasting users generate more value.
To calculate it, use this formula:
LTV = Average Revenue per User × Average Customer Lifespan
ARPU (Average Revenue Per User) measures the average revenue generated per active user (paying and non-paying), while ARPPU (Average Revenue Per Paying User) measures how much revenue each paying customer generates on average.
While similar, both metrics are important because ARPU shows overall monetization efficiency, while ARPPU highlights the value of your paying segment. Tracking both helps developers understand whether revenue growth comes from expanding the paying audience or from increasing spend among existing customers.
The formula for both are similar as well. You can calculate each with these formulas:
ARPU = Total Revenue / Total Active Users
ARPPU = Total Revenue from Paying Users / Number of Paying Users
Performance metrics show your app’s load speed: how your app interacts with a hosting device such as a computer or server.
App speed affects your users’ experience by shaping how long (or short) users have to wait to navigate your app.
The 5 performance metrics include time to first byte, average screen rendering time, API latency, app load per period, and app crash analytics.
Time to first byte (TTFB) measures the amount of time it takes for your mobile app to receive data from a server.
The ideal response time ranges from 1.9 to 3 seconds.
A few techniques to reduce TTFB are:
Average screen rendering time is the time an application takes to load your app’s content: images, videos, and animations.
App screen rendering times differ for applications based on their complexity, ranging from 1 second for simple apps to 5 seconds for complex apps.
Common causes of slow screen rendering time include:
Application programming interface (API) is the part of a server that receives and requests responses. For example, when you log into Facebook, you’re requesting access to Facebook’s server. When Facebook’s server receives and interprets your request, it processes it and displays the page.
So, API latency is the time it takes for APIs to request and receive data, or the time it takes for Facebook to load.
An ideal latency time is between 1 - 3 seconds but largely depends on the number of APIs the application uses.
App load per period is the number of transactions or events your mobile can handle in a set time. Test app load per period by clicking app features rapidly to overload the app.
It is important to know the maximum load per period your application can handle, since app users may click a feature multiple times.
An app crash occurs when your app closes abruptly while being used. Frequent app crashes can lead to frustrated users and eventually, high app uninstalls.
There are multiple reasons for app crashes:
You can use Google Mobile Analytics to analyze app crashes and identify the mobile devices or pages where the app crashes.
Consider the tale of the Super Mario iOS game that Apple and Nintendo launched in December 2016.
The app received 2,850,000 downloads on the first day. After four days, the number of downloads rose to 40 million – a rate that surpassed Pokemon Go.
Surprisingly, the Super Mario game received more one-star ratings than all other ratings combined, averaging 2.12 stars.
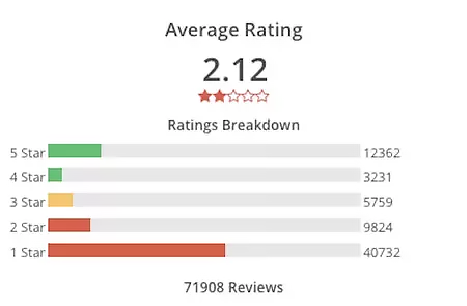
Source: Recode.net
What started as a successful marketing event, turned out to be a disappointment for Nintendo. While users downloaded the Super Mario game, they did not enjoy it and gave it low ratings.
This example shows that measuring the number of app downloads may not translate to a successful app. What matters are how users engage with your app.
The challenge with developing an app for your business is understanding what key performance indicators (KPIs), or metrics, to track to determine the success of your app.
There’s a difference between getting a user to download your app and getting a user to be excited about your app and continue to use it over time.\
If the app downloads are lower than you expected, it doesn’t mean your app is a failure.
Learn which metrics your business should track to determine app success.
The exact figures for each metric and the benchmarks are unique for every business and every application.
It will take a decent amount of effort and time to set up and analyze these metrics, but make sure you do not get analysis paralysis. Monitor only the metrics that will help achieve your goals.
Kunwar pal Singh heads up content marketing at Daffodil Software Ltd., a global web and mobile app development company headquartered in Gurgaon, India. He loves to keep abreast of emerging trends in mobile technology and design and often writes on subjects about mobile app development, marketing, and user experience.
See full profile